There are two major ways of using Technical Analysis for trading/investing
1. Mean Reverting Strategies 2. Trend following Strategies
As we know that Technical Analysis is the study of Price Movement of any Stock/Index/ETF/Derivative/Other Securities to forecast its upcoming move. This analysis can be used for trading as well as long-term investing by using multiple tools like – Trendline, Support & Resistance, Technical Indicators, Classical Chart Patterns, Candlestick Patterns etc.
|| Pro Tip: As we understood that Technical Analysis can be used in various ways however mastering any single or combination of two – three tools along with proper Risk Management & Money Management is the key to success and will keep you away from crowd. ||
(Note – The author uses only Classical Chart Patterns along with only one Technical Indicator i.e., Volume, which he seems to be practical and easily interpretable for him.)
There are two major ways of using Technical Analysis for trading / investing:
- Mean Reverting Strategies
- Trend following Strategies
Mean Reverting Strategies:
Mean Reverting Strategies are those strategies under which a trader / analyst / investor observes that respective security (trading/investing instrument) is not trending in any specific direction and is currently moving sideways or within specific range and therefore uses any Support or Resistance / Pivot Point / Box patterns etc. to churn some of the move where the security reverts to its Mean:
Example: Apple Inc. – Daily Chart (Plotted using TradingView platform)
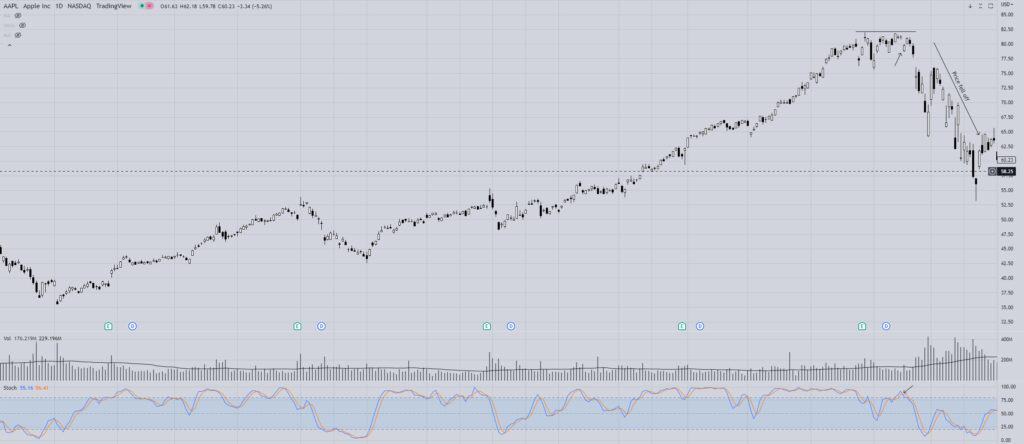
Note – Here on the marked point in above picture, readers can observe that Apple Inc. was not moving much for some days and suddenly there was a Harami Cross pattern along with Doji candle and further gap down candle (marked with arrow above) which closed below previous candle’s range (High to Low distance and vice versa) which confirmed the bearish sentiment for Apple Inc. and later the icing on the cake was done by the confirmation provided by Stochastic Indicator and an analyst/trader would have taken Short position in this stock to make some good money by placing Stop Loss at previous candle’s high/previous swing high and Take Profit as per his personal Reward to Risk Ratio or at the nearest Support Line.
Now readers can observe that Price reverted back to its recent Mean i.e., 54.34 level (marked with dotted lines).
|| Pro Tip: This way of using Technical Analysis is majorly profitable in rangebound market and may trigger lots of trades with small number of profits. Usually, it has been observed that mostly novice traders are inclined towards this method of trading due to very short span of trading timeframe and availability of quick profit/loss opportunities. ||
Trend following Strategies: Always remember, ‘Trend is your friend’; and this method of trading/investing in securities is called Trend following Strategies. Under this method, the trader/investor identifies a major trend first and then initiates the trend in trend’s original direction.
Example: Apple Inc. – Weekly Chart (Plotted using TradingView platform)
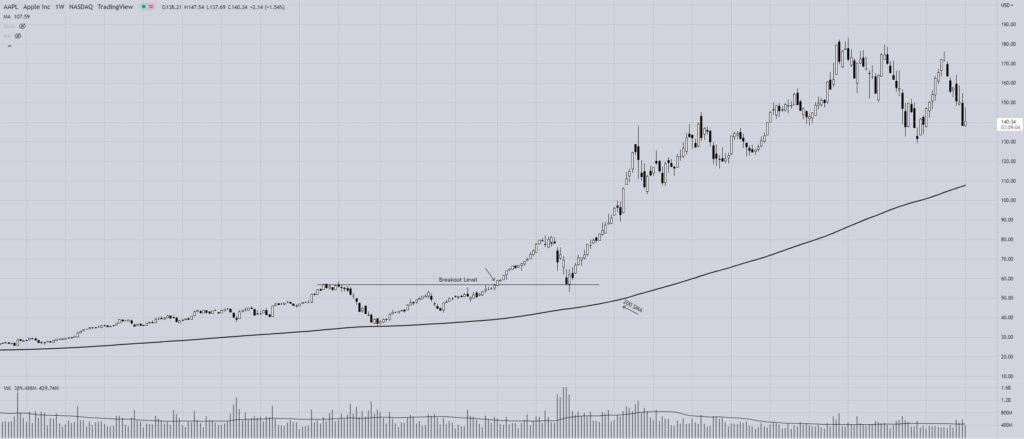
Note – Here on the marked point in the above Chart of Apple Inc., the trader/investor could have observed that there is new Breakout in this stock (marked with horizontal line and lebel – Breakout Level) and the prevailing trend is also rising which is discernible from the 200 period SMA (Simple Moving Average) and would have helped trader/investor in initiating long position in this stock with a Stop Loss at nearest swing low and Take Profit as per personal Reward to Risk expectation or merely trailing profit using any Moving Average.
|| Pro Tip: This way of using Technical Analysis is majorly used by Fund Managers, Swing Traders, Positional Traders and many of the novice traders/investor switch to this way of using Technical Analysis once they feel that Mean Reverting methods are not suiting their personality and they need some relaxed method of trading/investing where they do not need to check price chart very often. ||
Pingback: Does Technical Analysis really work? - Professional Technical Analysis
Why 8230?