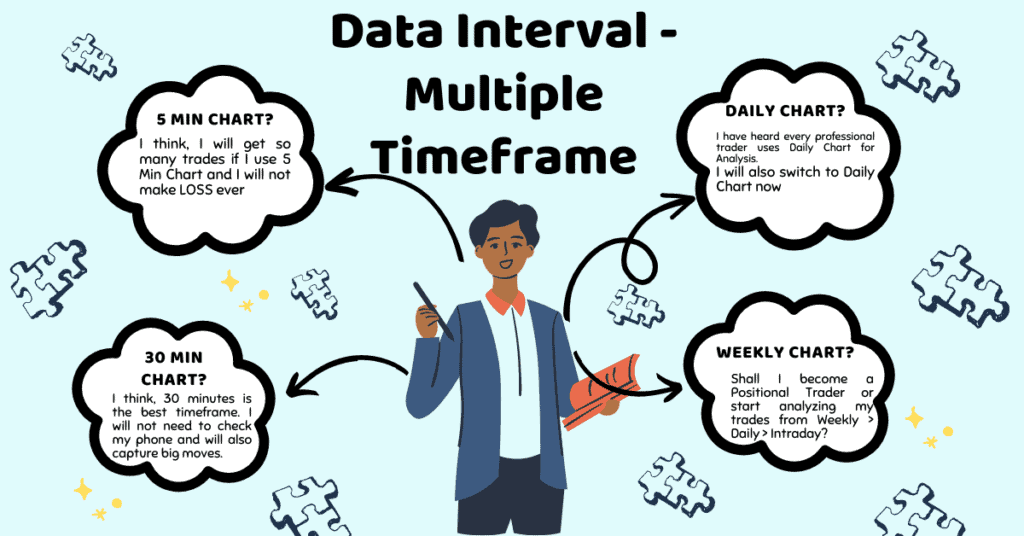
Data Interval is the time gap between two data points referred to as a data interval in technical analysis which is sometimes also referred as Multiple Timeframe analysis. It is the time frame used to depict an asset’s price movement on a chart. Depending on the trader’s inclination and trading style, the interval can be set to any time range, including Ticks, Minutes, Hours, Days, Weeks or Months.
- For example, if you are using a 5-minute chart, each candlestick represents 5 minutes of price action. If you are using a daily chart, each candlestick represents one day of price action.
Data Interval also known as Multiple Timeframe in Technical Analysis is the key to succeed in Market because trends frequently behave in a consistent manner throughout a wide range of time frames, technical analysis ideas and techniques can be used on any time frame. Once analysts are familiar with the basics of Price Charts, they can use those techniques in a variety of time frames, from extremely short-term intraday trading to long-term investing.
Choosing the right Time Frame
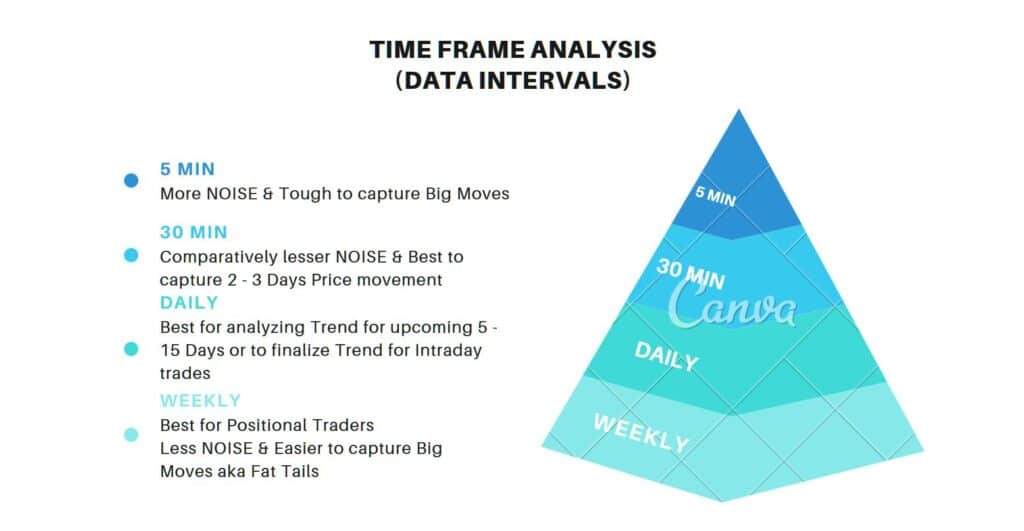
The best data interval for your trading strategy is determined by your trading style. Consider larger data intervals (viz. Weekly, Monthly) if you want to make bigger moves and stay in a position for a longer period of time. Consider short data intervals if you trade for smaller moves and like to be in and out of positions rapidly.
For example, if you are a day trader who likes to be in and out of positions quickly, you might use a 1-minute chart or a 5-minute chart. If you are a swing trader who likes to hold positions for several days or weeks, you might use a daily chart or a weekly chart as your Data Interval.
Example:
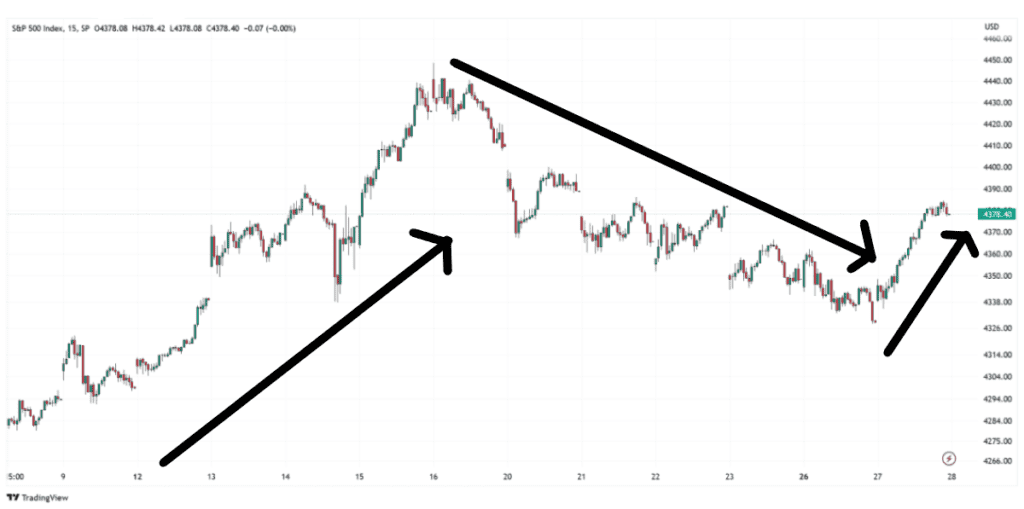
- This is a 15 Minute Data Interval Chart or 15 Minute Chart which is Cluttered and Price’s actual trend is not understood. Currently we are seeing that Price was earlier in ‘Uptrend’ however currently it is in ‘Downtrend’ and even right now whether we should go long or wait for the direction to be decided by market.
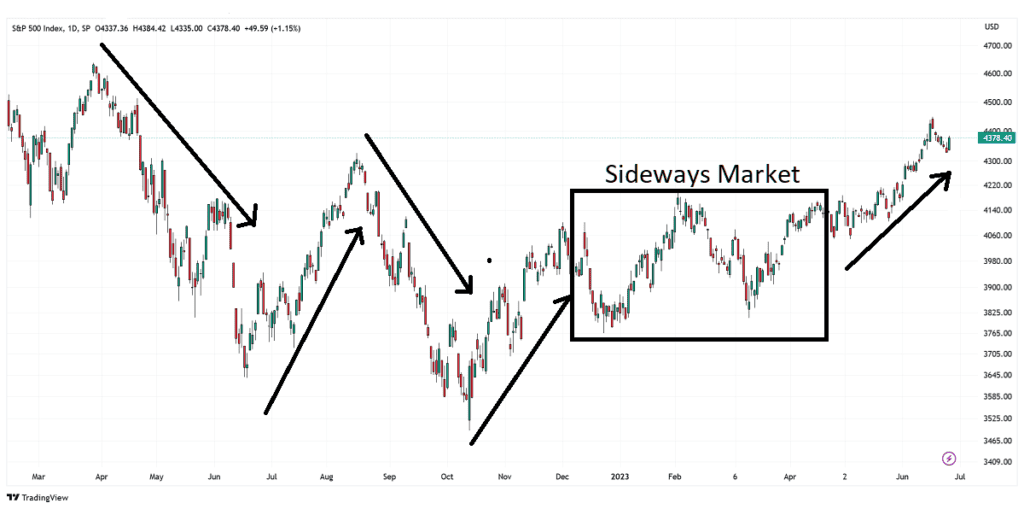
- The same Price Chart is here below in Daily timeframe and here we can observe that overall trend was quite Sideways and Price earlier went Up then came down and repeated then stayed there in completely choppy market for long and currently its moving upward slowly with Breakout of Sideways Market:
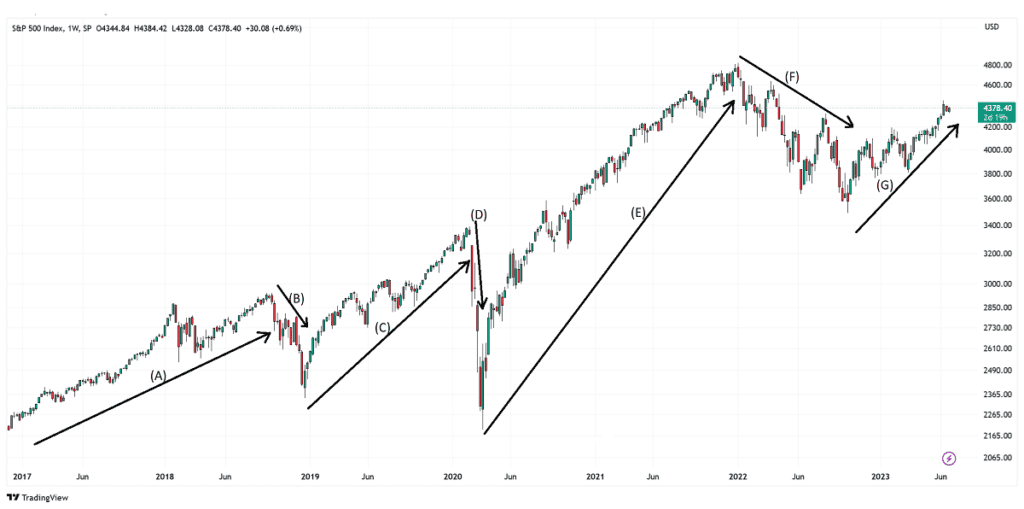
- Finally, we now check the same Price Chart below in Weekly timeframe and we can observe that Price was actually in a prolonged Uptrend marked with Point (A), (C) and (E) with minor Corrections marked with Point (B), (D) and (F) which a prudent Positional Trader must avoid and stay with Uptrend only however recently it has been sideways at Point (F) and there is ‘No clear Trend’ as of now for Breakout Traders which is marked with Point (G)..
So, what shall we do?
First of all, stay calm. Look at Weekly Chart whether any trend is visible or not in ‘first glance’, then switch to Daily Chart and confirm whether the same trend is continuing or is currently in opposite direction and only when both three time frames or data intervals are showing the same trend then switch to lower time frames viz. 75 Minutes, 30 Minutes, 15 Minutes or any other data interval of your choice and take trend only in the direction of Major Trend viz. We can observe ‘Upward Arrow’ has been marked in Weekly > then in Daily > then in 15 Minutes so it means “Traders must stay with the trend and look for LONG opportunities only”.
===============================================================================
Pro Tip: This technique will decrease your probable number of trades drastically however it will give you very High Probability trades.
-ProTechnicalAnalysis.com
About the Author
Vivek Kumar, CFTe is currently pursuing Chartered Market Technician – Level III and is very passionate about Technical Analysis. Apart from his passion, he is a seasoned Banker and is having hands-on experience on various financial products viz. Options, Futures, Mutual Funds, ETFs, Loans etc.Feel free to write to [email protected] in case you have any query regarding Technical Analysis related terms or practical issues.