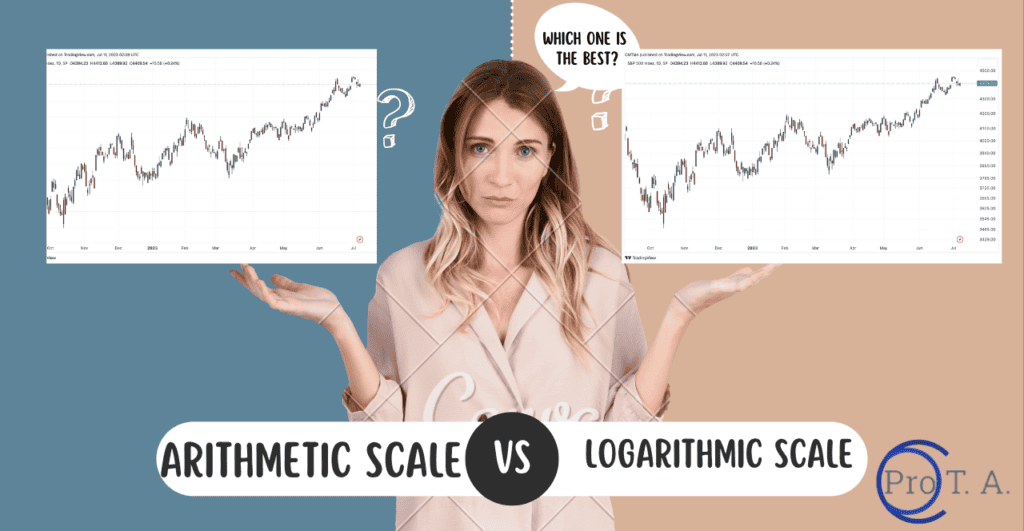
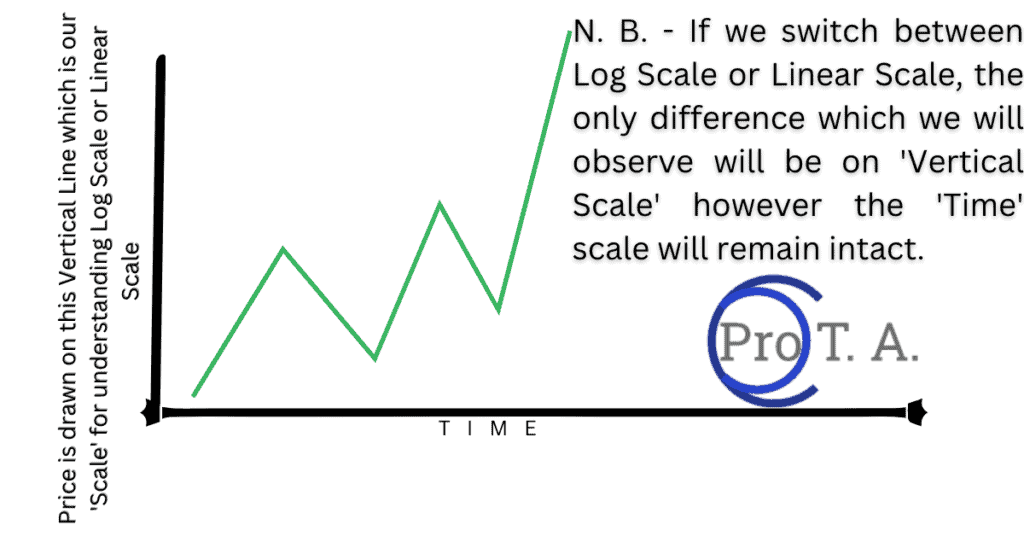
Log Scale vs Linear Scale charts are a type of Price Charts which are plotted on Vertical Scale of any Charting Platform i.e. if any Charting Platform is showing Price Chart between |__ these Vertical and Horizontal Line where the bottom Horizontal Line __ denotes ‘Time’ then that Price data which is shown at the scale of ‘|’ – Vertical Line -is the Scale and this Scale is what differentiates Log Scale and Linear Scale also known as Logarithmic Scale and Arithmetic Scale respectively. Now, we will look at the picture below to understand these jargons easily:
Key Differences
Log Scale vs Linear Scale – They both have their own unique qualities and both are being used at different places which we will see below in detail.
Logarithmic Chart or Log Chart – The logarithmic price scale, commonly known as log, shows price spacing on the vertical or y-axis based on the percentage change / log change in the price of the underlying item. It means if price move from 10 – 20 then it will show 100 % change and if price then moves from 20 -30 then it will show 50% change despite it was also 10 points move.
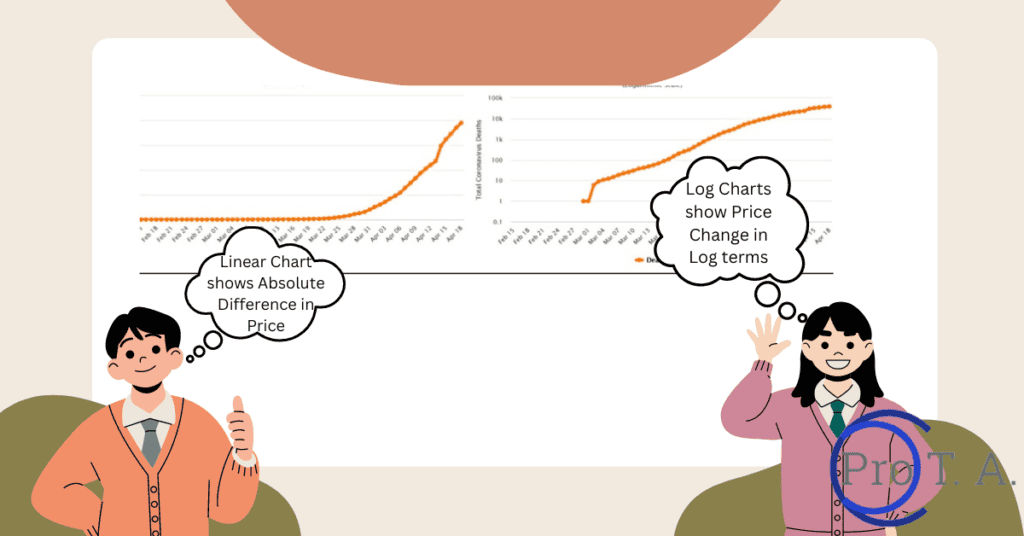
Linear Chart or Arithmetic Chart – Arithmetic or Linear Price Scale represents price on the y-axis with equidistant spacing between designated prices. Linear graphs show absolute values. This is the most common chart style. It means this scale will show equal distance if price moves from 10 – 20 and then 20 – 30 as in both the cases there were absolute change of 10 points only.
Which is the most commonly used Chart
Usually, whatever Charting Platform we will look at, shows ‘Linear Scaled’’ Price data only. Some of the Charting Platforms are having the same facility however they call it as ‘Arithmetic Scale’.
Which is better to chart Logarithmic Chart or Linear Chart
The short answer to this question is – It completely depends upon the Data Interval we are looking at and what is our goal. If we are doing Day Trading then any of these will work perfectly considering a Breakout in Logarithmic Chart will 99.99% also show as a Breakout in Linear Chart as well. But if we are doing Investing / Positional Trading then we must use a Logarithmic Chart as it will show a huge Price fluctuation like a smooth wave and will make our life easier to understand overall Price move and take a decision upon our Entry / Exit.
Why is Log Chart better than Linear Chart
Log Chart is better than Linear Chart as it shows a huge Price movement in a form of smooth Price Pattern. We can switch ourTechnical Analysis study to Log Chart in case we are interested in Big price moves and we can also switch to Log Chart in case we want to do Day Trading in only one instrument for life time viz. SPX, NIFTY etc. then a Price move of 20 points will not be equal after 10 Years as the range of SPX or NIFTY will expand by default with time due to inflation so in those cases again searching for a Breakout after 20 points will not make sense due to change in value of Price because of Inflation hence in those cases Log Chart will help us as it will show the same Price move of 35 Points as the move of say, 20 Points then and it will keep ‘Self Adjusting’ to the Price range.
What type of Chart is the best and which is most effective
We must use Linear Scaled Chart aka Arithmetic Scaled Chart in case we are not analyzing a Price change of 100% or 300% to find our entry as it will work perfectly fine for all other tasks and we must switch our Price Chart to Log Scaled Chart aka Logarithmic Scaled Chart in case we need to analyze Price Move of 100% or 300% to find our entry as people interested in Monthly – Data Interval are.
What are the reasons for using a logarithmic scale instead of a linear one?
As we mentioned in above mentioned text, there can be two major reasons why we might need to switch our Price Chart to Log Charts aka Logarithmic Charts
- If we are trading the same instrument for Day Trading and have decided to stick to this instrument only for next many years then Log Charts will help us identify our Entry / Exit criteria with the same strategy even when the Daily Price range has changed with time
- If we are interested in capturing Big Price moves viz. 100% or 500% of Price Moves as Monthly – Data Interval users usually are.
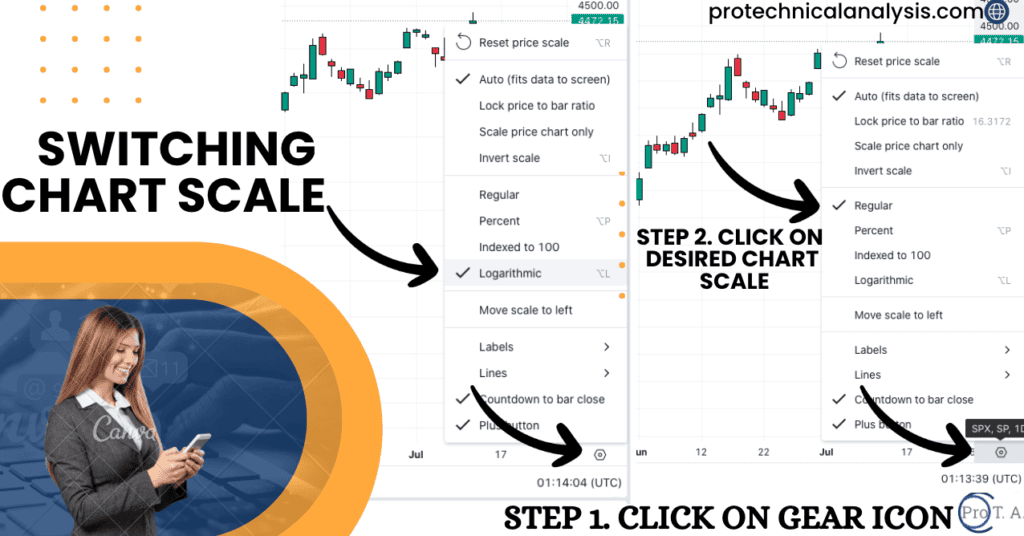
How to plot Logarithmic Scale Chart or Linear Scale Chart?
We can plot any of these Chart Types on mostly any of the Charting Platforms now a day and to do that we need to look for ‘Gear Icon ‘ on our Charting Platform and just click on desired scale. A picture of this facility has been taken from ‘TradingView’ platform and placed below for your ready reference
With FREE live online lessons, exercises, and interactive content, ProTechnicalAnalysis’ Technical Analysis course will teach you crucial and advanced technical analysis abilities.
(Drop a mail to [email protected] or fill the Contact From to enrol into FREE live interactive sessions.)
About the Author
Vivek Kumar, CFTe is currently pursuing Chartered Market Technician – Level III and is very passionate about Technical Analysis. Apart from his passion, he is a seasoned Banker and is having hands-on experience on various financial products viz. Options, Futures, Mutual Funds, ETFs, Loans etc.
Feel free to write to [email protected] in case you have any query regarding Technical Analysis related terms or practical issues.