Technical analysts look at data from markets to see patterns and trends by using Charts or Indicators
https://protechnicalanalysis.com/
Technical analysis is a way of predicting the future price movements of financial markets by analyzing any security’s historical Price data. This approach is based on the assumption that past patterns can be used to predict future trends. Technical analysts believe that market trends and patterns tend to repeat themselves, so by analyzing these patterns they can identify potential buying and selling opportunities.
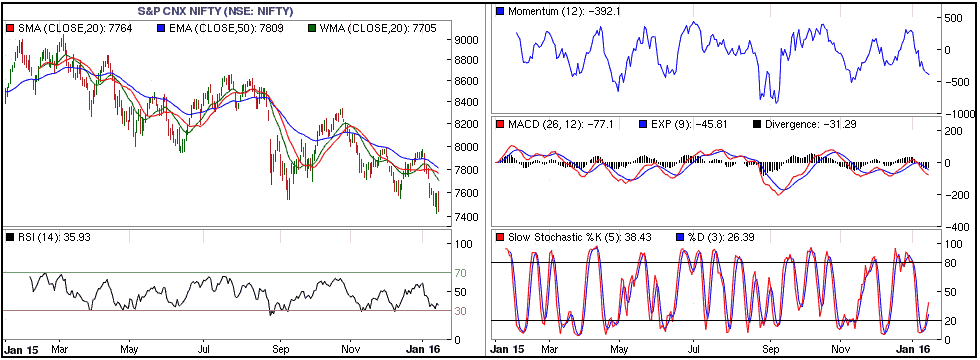
Technical analysts look at data from markets to see patterns and trends. They use charts, indicators, and oscillators to do this. Charting can show how the price and volume of a market have changed over time, and indicators can give you more information about what’s happening in the market. Oscillators can help you figure out how fast a market is moving
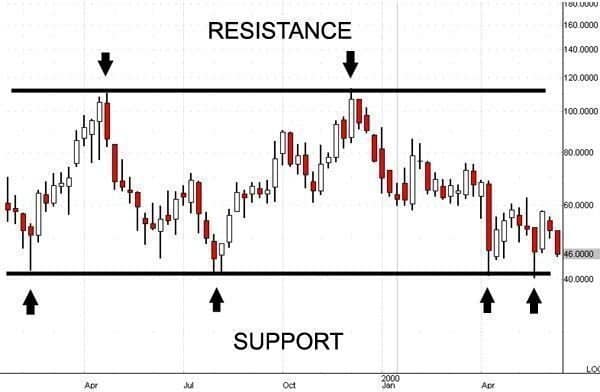
Trend analysis is used to see what the general trend is in a market and to predict where prices are likely to go in the future. Support and resistance analysis is used to see where buyers and sellers are likely to be most active and to predict where prices are likely to stay. Momentum analysis is used to see how fast prices are moving and to predict whether the trend is likely to continue or reverse.
Technical analysis is a way of looking at the stock market that can be helpful in figuring out when to buy and sell stocks. However, there are some people who don’t think it is as reliable as other methods, and it doesn’t always take into account things like economic data and company performance.