
Candlestick Charts are also a type of technical chart which shows the price movement of any security/script during a given time period and it shows four different data at a time i.e. – Open, High, Low & Close (OHLC).
Construction of Candlestick Chart:
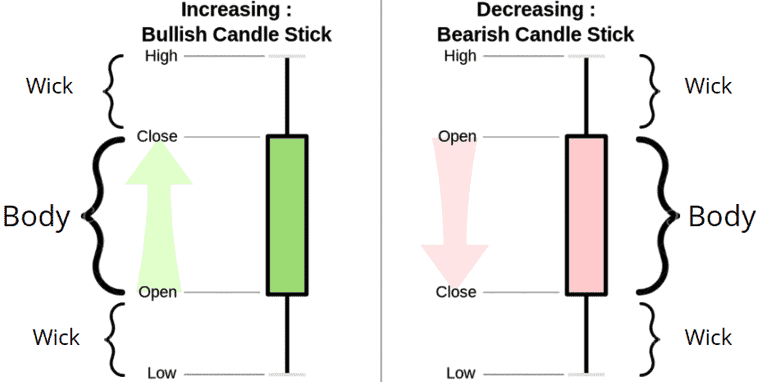
- Usually those candles where Price had opened higher however it had closed ultimately lower is mostly shown as ‘Black’ or ‘Red’ colored Candlestick (called Filled or Bearish Candle) and it can be changed by the user as per her/his own convenience and the reverse theory applies back to candles where price had opened at lower level however ultimately Price had closed on a higher level is being shown by ‘Hollow’ or ‘Green’ Candle (called Hollow or Bullish Candle).
- The rectangular part of these candles is called ‘Body’ and the Lines which are showing how much Low/High Price has extended from their respective Open/Close is called ‘Wick’ or ‘Shadow’. ||
History
This charting technique, which originated in Japan, was used as early as the mid – 1699s to trade rice futures. Although it has been used for centuries in Asia, this type of charting did not become popular in the United States and European Markets until the publication of Steve Nison’s Japanese Candlestick charting Techniquesi n 1991.
Example: Daily timeframe Price Chart of SPX500 plotted using TradingView platform
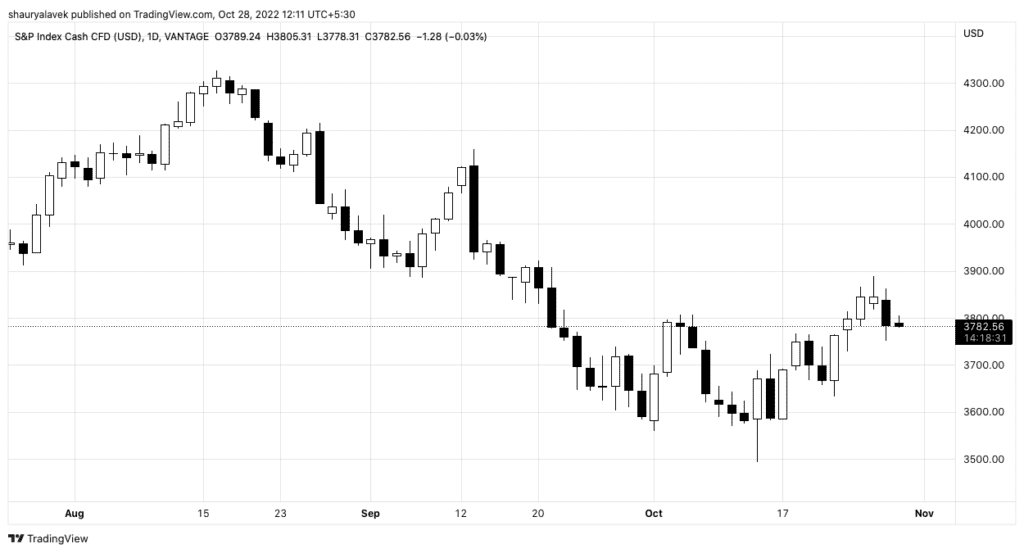
- || Pro Tip: We can observe tail (Wick) which is visible in almost every Candlesticks (also called Candles) is price extended apart from Open to Close price during the entire Day. Professionals also call this tail/wick as price range extended by Novice traders due to FOMO (Fear of missing out) and give more emphasis to Closing Price than Tail/Wick. ||
How to plot Candlestick Chart
As Candlestick charts have become very famous after Steve Nison’s book – Japanese Candlestick Charting Techniques and accepting the fact that it is very much easier to observe Candlestick Patterns rather than Bar Patterns due to it’s eyes relaxing design, almost every Charting Platforms allow plotting Candlestick Chart along with Bar Chart / Line Chart.
We can use below mentioned famous FREE Charting platforms for our easy access to Candlestick Charts:
- TradingView.com
- Investing.com
- moneycontrol.com
- Stockcharts.com
- Yahoo Finance