Hammer is the highest rated reliable Candlestick pattern by many Pro Traders
Hammer appearing on recent Support area increases the probability of the setup especially when it is also confirmed by any technical indicator
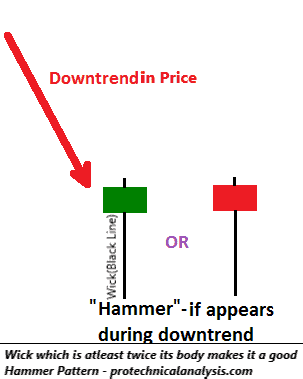
Hammer is a single Candlestick reversal pattern in technical analysis whose tail is at least twice of its body and the body is mostly small with ‘very little’ or ‘no’ wick at the top of the candlestick body.
The below picture is what we call a Hammer candlestick pattern:
https://protechnicalanalysis.com/
Points to remember while trading Hammer Candlestick Pattern:
Hammer is the HIGHEST RELIABLE candlestick pattern when it comes to making profit as per many statistical results even the book of Bulwowski has ranked it on No. 1 in its category
In case the tail is too long (a relative term) and real body is too short, Hammer is also called as a Pin Bar by many technicians
The same candlestick will be called a Hanging Man, if appears during uptrend
Body Color is not relevant when trading Hammer Candlestick Pattern, it may be Bullish or Bearish, the outcome is same i.e., Highly Reliable pattern
Many technicians also call candles of this kind a ‘Hammer’ even when the real body is just the size of its body however the same is not as much reliable as the criteria shown as per my personal trading observation which is the tail should be at least twice the size of its real body
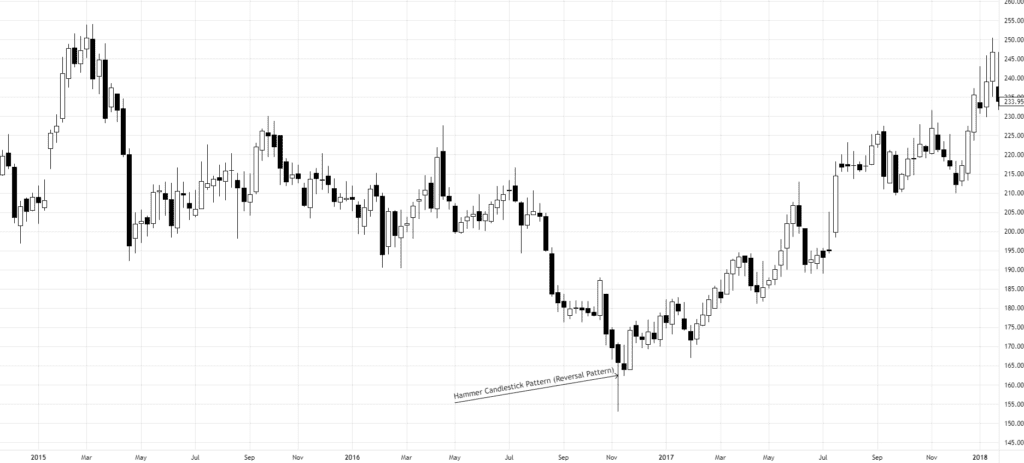
Example of Hammer pattern:
Hammer Candlestick (Reversal Pattern)
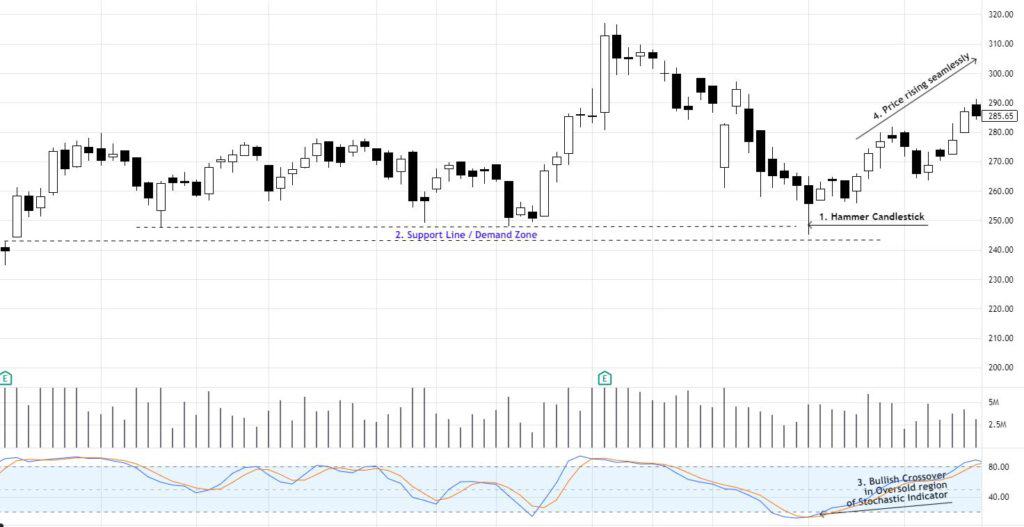
|| Pro Tip: Hammer is a fantastic and very reliable pattern however to increase our accuracy, we must use confirmation from other technical tools. Like – Use Stochastic Indicator which is showing Bullish Crossover at Oversold region when Hammer appeared along the draw a Support line which further signifies that this Hammer is signaling a ‘High Probability Reversal’. ||
Example of this High Probability Reversal Setup:
Daily timeframe Chart with High Probability setup of Hammer candlestick patter
Step 1. Identify good Hammer Candlestick (Do not trust Pin Bars which look like Hammers however their Wicks are almost 4 – 7 times of their real body)
Step 2. Check whether there has been any reversal from this area in the past i.e., whether it has appeared on Support Line / Demand Zone
Step 3. Is there confirmation from Volume (In this picture, last three Volume Bars are showing Increasing Volume on daily basis) and Stochastic Crossover (In this picture, Stochastic Crossover has taken place in its Oversold region. We as per our study use Stochastic with 14,3,3 setting only.)
Step 4. Check your risk to reward ratio. (We place Stop Loss at ‘Low’ of Hammer Candle and Take Profit at minimum Reward to Risk ratio of 3:1)
||Pro Tip: Always maintain a Trading Journal to determine whether your system is working or not. This one habit will keep you ahead of almost 90% of other traders. ||