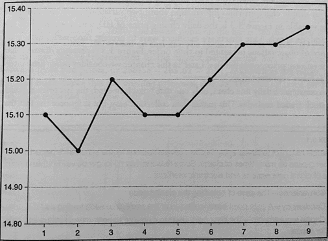
Line Charts are those type of price charts which includes closing price (mostly) of any Stock/Security. Connecting the price data of Closing Price – dots as per below mentioned picture will produce a Line Chart:
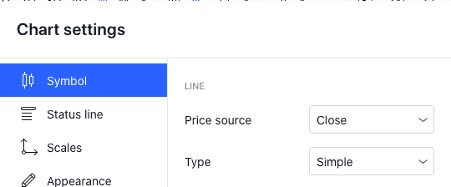
Line Chart can also be drawn using Open/Low/High Price data however most Professional Traders/Investors use Close Price only
|| Pro Tip: Line Charts still are valuable tools today as professional in this industry say that markets are opened by amateurs and is closed by professionals hence closing price is the most important price for any positional trader/investor and therefore Line Charts are mostly drawn using Closing Price only. ||
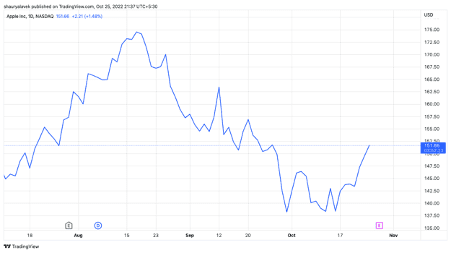
Example – Apple Inc. (Daily Chart) plotted using TradingView platform:
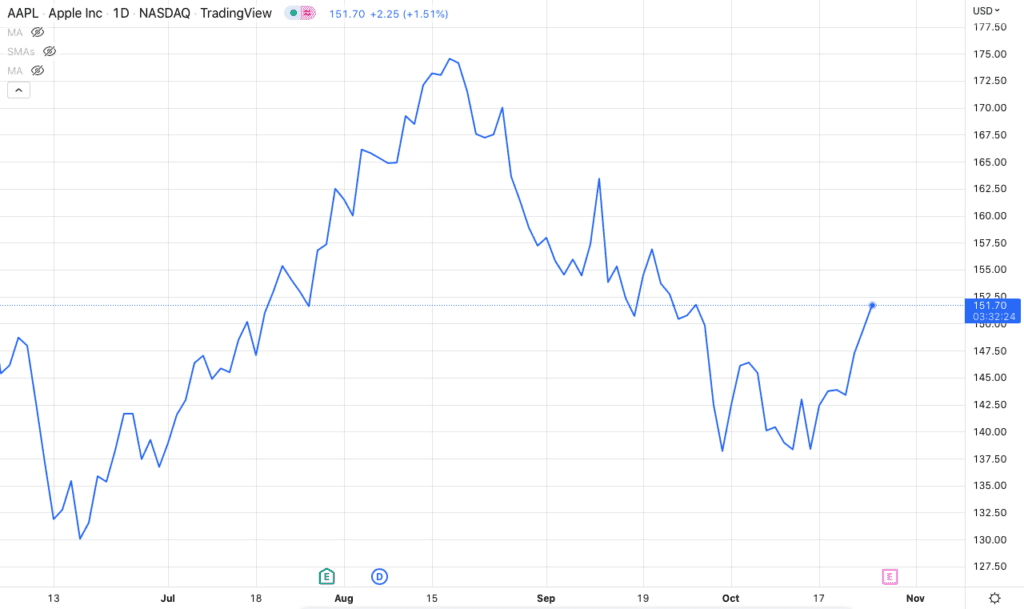
This Daily timeframe chart is created plotting only the Daily Closing Price (Last traded price during an entire day) for Apple Inc. Although the stock is traded throughout the day, only one observation, the last trade of the day, is captured and plotted. Although this does not give a complete picture of what has happened to the price of Apple Inc. over that time period, it shows the underlying price trend.
This simple chart provides information about two variables: Price & Time. The price variable in above figure is the daily closing price of Stock ABC, and it is placed on the vertical, or y, axis. Line Charts are excellent ways to present time-series data, a sequence of observations presented in time order.
|| Pro Tip: Line Charts are excellent tool in ‘Breakout’ trading system as many times traders observe some Breakout taking place in any Stock/Indices and at the same time they also observe some Candlestick/Bar Chart pattern in that final candlestick/bar and get confused whether they should punch their trade or not (Like finding any Spinning Top pattern on Breakout). This is a classic issue, which I had also faced during my initial period of trading hence using a Line Chart in Breakout system will keep you away from biasness completely. ||
Author – https://protechnicalanalysis.com/