Definition
A trendline is a straight or curved line (changing with Security’s Price viz. Moving Average) that is generally shown on a Price Chart to help visualize the general direction of Security’s Price Trend. It can be used to evaluate any data that has a trend over time, but it is frequently employed in technical analysis to find and study trends in financial markets.
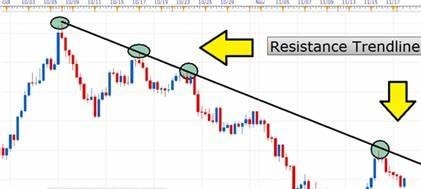
To indicate the underlying trend in a market, trendlines are created by connecting two or more price points on a chart (either Close, High or Low only). A Downtrend Line is created by connecting High Points (also called Resistance) of the price of an asset, and an uptrend line is created by connecting the Low Points (also called Support). With a trendline, traders can spot important levels of support and resistance as well as potential breakouts or trend changes.
Drawing Resistance Trendline
Refer picture below:

Drawing Support Trendline
Refer picture below:

Drawing a trendline involves identifying the general direction of a dataset and then drawing a straight or curved line that best represents the trend. Depending on the type of data and the tool being used, the precise procedure for drawing a trendline may vary, but the following are some general steps you can follow:
- Choose the appropriate type of chart: The first step is to choose the appropriate type of chart for your data. The most common types of charts used for trend analysis are line charts and candlestick charts.
- Identify the trend: Look for the general direction of the data. In an uptrend, the data points generally increase over time, while in a downtrend, the data points generally decrease. In a sideways trend, the data points fluctuate within a range. You can also plot 200 day Simple Moving Average which is an industry standard for determining trend.
- Choose the points to connect: Once you have identified the trend, choose the data points that you want to connect with the trendline. In an uptrend, connect the low points of the data, while in a downtrend, connect the high points.
- Draw the trendline: Using a ruler or the drawing tool on your chart, draw a straight or curved line that best represents the trend. Mostly these tools are named as ‘Trendline’ in charting platforms.
- Adjust the trendline: If necessary, adjust the trendline to better fit the data points. This can be done by moving the line up or down, or by making it more or less steep.
- Interpret the trendline: Once the trendline is drawn, use it to identify key levels of support and resistance, potential breakouts or trend reversals, and to make predictions based on the underlying trend.

Pro Tip: Always use (a) High of Candles / Bars or (b) Low of Candles / Bars or (c) Close of Candles / Bars to draw a Trendline. NEVER let your trendline touch High/Low along with Close price.
https://protechnicalanalysis.com/